Tag Archives: bandwidth

Dashboard Charting Now Available in CyBlock Cloud Service

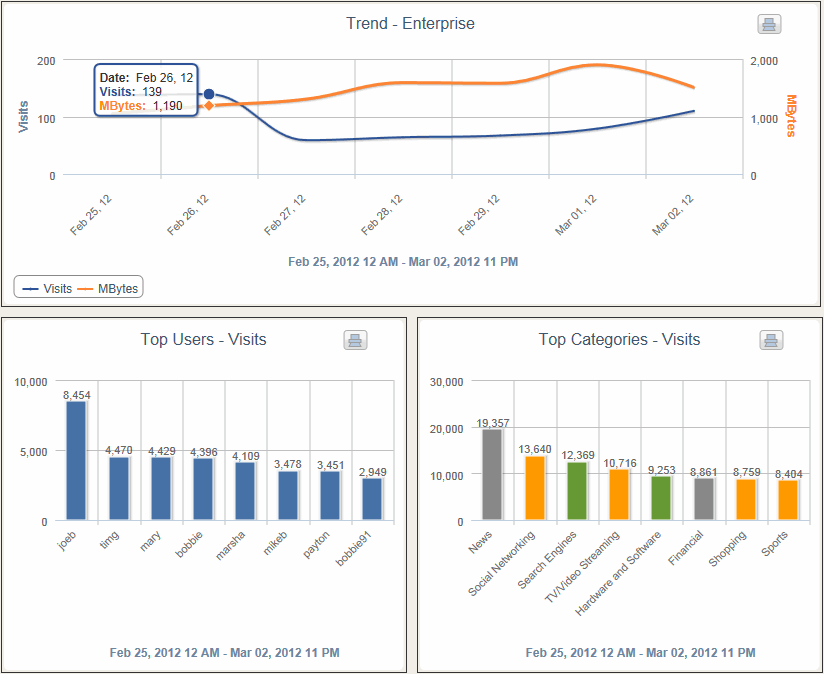
The CyBlock Cloud service dashboard provides multi-perspective, high-level trend and bar charts. A number of these ‘quick-look’ displays depict Web-use activity trends from a variety of perspectives. Others compare activity between users, groups, content categories, and sites. The Dashboard’s easy-to-interpret charts provide an efficient way to quickly determine the amount and characteristics of Web activity and identify problems that may exist.

Dashboard Home
Get a quick overview of your entire organization’s Web activity.  Spot spikes in visits and bandwidth. Identify top users and most visited categories.

dashboardhome

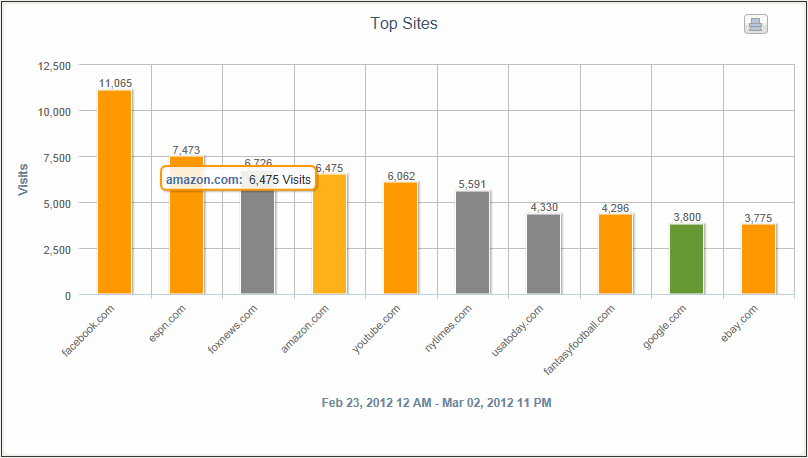
Top Sites Visit Chart
Find out which ten sites had the most visits for the time period you specify.

topsitesvisits


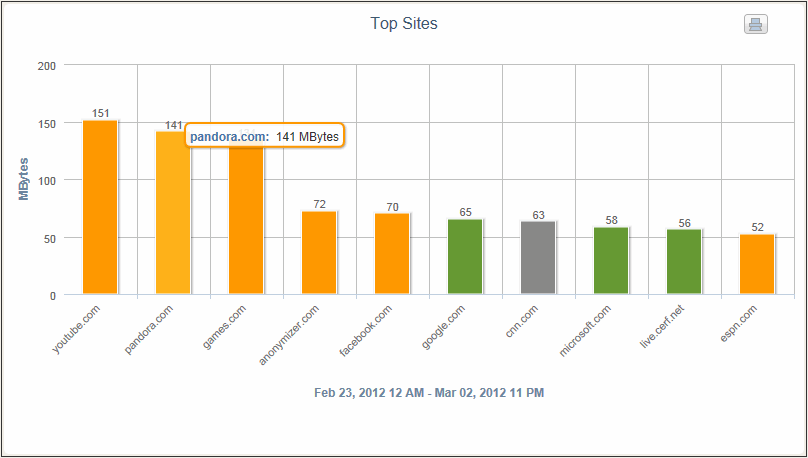
Top Sites Bandwidth Chart
Find out which ten sites are consuming the most bandwidth for the time period you specify.
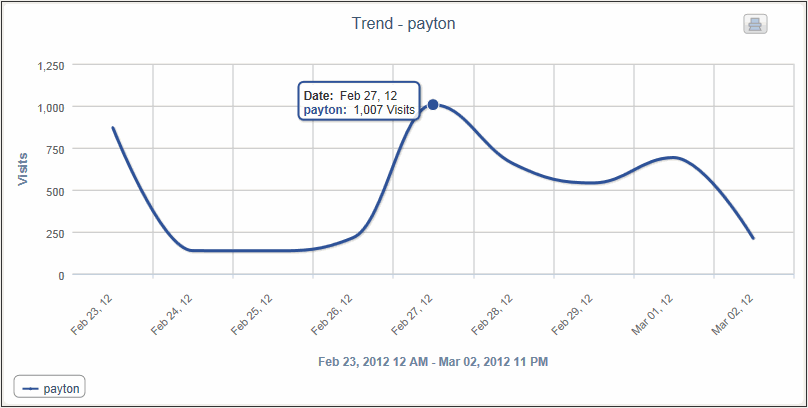
topsitesbandwidth


User Trend Chart
View Web-use visits, hits, or bytes over time for users, groups, categories, and acceptability classifications.
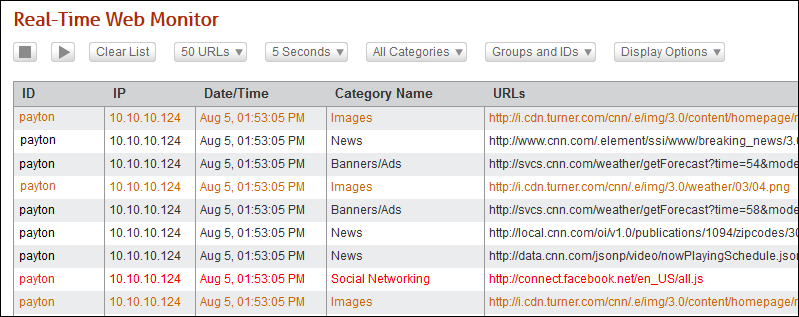
usertrend


Web Monitor
View Web activity in real time by user ID, the full clickable URL, and its category. Filter on users, groups, or categories to be displayed.

RTMWebResults


Concerned About Bandwidth Usage During March Madness?

Bandwidth is a main concern for many businesses during this March Madness season.  Many must deal with employees using company resources to enter online office pools, blog about the top seeds, and watch live streaming games that take place throughout March and early April.

In fact, CBSsports.com is expecting even more viewers online this year. They expect the number of unique viewers for March Madness on Demand, to rise 50% to 7.2 million viewers.  With the massive number of sports Web sites and streaming games available, companies can expect to see a considerable drain on employee productivity and network bandwidth during the NCAA Tournament.

While you may or may not allow your employees to follow the games at work, you will want to ensure that it doesn’t interfere with your network.  Wavecrest Computing offers Internet filtering by category or site, white list filtering, real-time web monitoring and detailed Web-use reports on a particular category or site and bandwidth usage.  Some reports you can use to monitor bandwidth or access to sports sites are:

  • Site Analysis Bandwidth Report
  • Network Information Report
  • Category Audit Detail Report
  • Category Audit Summary Report
  • Site Audit Detail Report

Source: https://www.marketingshift.com/2009/3/cbs-expects-7-millon-online.cfm